
by James Gregory
Oregon was the first of the West Coast territories to be claimed and occupied in force by the United States. White Americans began moving overland into the region in the 1830s intent on wrestling the land from its first peoples. After 1846, when Great Britain and the United States settled their competing claims to a vast Pacific Northwest region whose original peoples did not know that they were being claimed, the flow of migrants along the Oregon trail increased. That route, starting in the Midwest and adjusted for different transportation systems, has been key to Oregon's population growth ever since. Unlike its West Coast cousins--California and Washington--Oregon's migration history has, until recently, involved newcomers who were mostly White, mostly US born, indeed mostly from the Midwest.
Indigenous Oregonians may have initially been luckier than the tribal nations to the north who faced waves of disease brought by European mariners in the 18th century, but the overland invasions of the 19th century erased the difference and the sequence of conquest and pacification wars fought in the 1850s and 1860s added to the toll.
Oregon became a state in 1859 with a population of about 50,000, virtually all White, most from the Midwest, especially Illinois, Missouri, Ohio, Indiana. The new state government banned Black people altogether, a prohibtion that remained on the books (although not enforced) until 1926. Population expanded slowly until the 1880s when the Northern Pacific railroad connected Oregon to the rest of the nation. 1900 recorded a population of 413,000 which would double by 1930, origins remaining the same, largely the Midwest. World War II changed the state's economy, bringing defense industries and military bases, while accelerating migration. The population reached 1.5 million in 1950, 2 million by 1970, 3.4 million in 2000, and 4.2 million in 2022. Migration origins have changed since the 1980s. California and Washington became the leading origins, as the three Pacific coast states established a population exchange pattern. Oregon also began to diversify, attracting Asian origin immigrants and also Latinx people in substantial numbers. Notably, almost as many Hispanic migrants were born in California or Texas as have come from Mexico and Central America.
This visualization tool is hosted by Tableau Public and may take a few seconds to respond. If slow, refresh the page. Click here for other state migration histories.
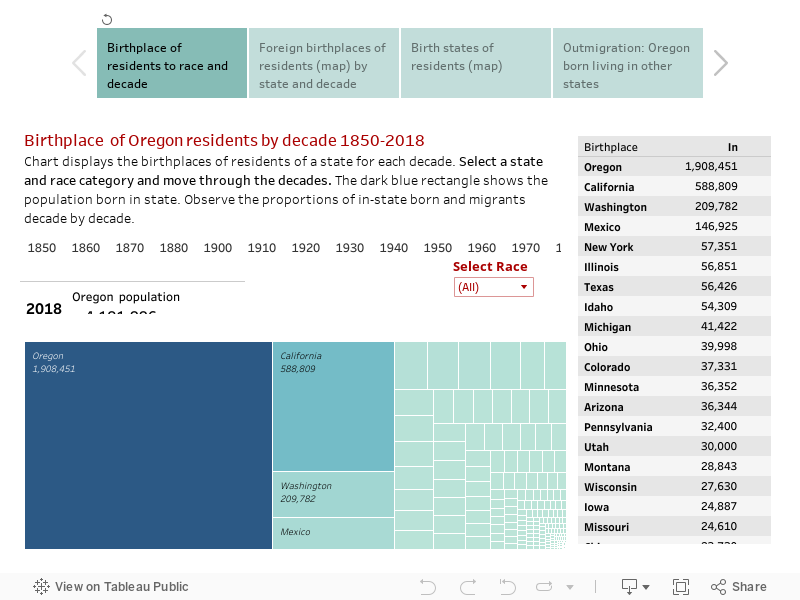
Move between four visualizations with tabs below
Note on data issues: Birth state information is missing for about 5% of US-born persons in 1970 and about 2% in 1960. These birthplaces are labeled "United States, ns" in the charts. Birthplaces were not recorded for enslaved persons in the 1850 and 1860 censuses, so it is not until 1870 that reliable data on African Americans became available. Native Americans were not routinely included in decennial censuses until 1900.
Source: U.S. Census data from the Minnesota Population Center's IPUMS USA: Steven Ruggles, Katie Genadek, Ronald Goeken, Josiah Grover, and Matthew Sobek. Integrated Public Use Microdata Series: Version 6.0 [Machine-readable database]. Minneapolis: University of Minnesota, 2015, the following samples: 1850 1%, 1860 1%, 1870 1%, 1880 1% 1900 1%, 1910 1%, 1920 1%, 1930 1%, 1940 1%, 1950 1%, 1960 5%, 1970 1% State FM1, 1980 5% State, 1990 5% State, 2000 1%, 2010 ACS, 2022 ACS.
Maps and calculations: James Gregory.