

by James Gregory
The first European immigrants to what would become the United States were bent on conquest and colony building for England, Holland, Sweden, and Spain. But most of those who followed in the 17th and 18th centuries were English with small additions from Scotland, Ireland, the Rhine region, and Holland. It is estimated that close to 90% of the white population of the newly independent nation in 1790 were of British ancestry (English, Scottish, Welsh, Scots-Irish), although that does not count the 750,000 enslaved persons of African ancestry or the still greater number of Indigenous Americans who found themselves within the spaces that the new nation claimed.
Great Britain continued to supply most of the Europeans who arrived in the early years of the Republic, but in the 1820s immigration from other parts of Europe accelerated, reaching a peak in the early years of the 20th century. Altogether since 1820 the United States counted more than 40 million immigrants from Europe - every part of Europe. Their descendants today total nearly 200 million.
This page introduces the history of European immigration--one of the "great migrations" that have transformed America. It utilizes the interactive maps, charts, and tables found on the Mapping European Immigration and Ancestry page. Those visualizations allow us to separately track the migration history of people from every part of Europe since 1820. We also report on the state-to-state population of persons born in Europe and separately on census information on ancestry. GO TO MAPPING PAGE
From its start, the United States welcomed immigrants from Europe. There would be no mechanisms for restricting or even monitoring immigration for nearly a century. Anyone could settle in the United States. Moreover, the 1790 naturalization law decreed that any "free white" person who had lived in the country for only two years could become a citizen and would quickly be eligible to hold any public office, except that of President. A few years later, as war with France threatened, Congress passed a set of alien and sedition acts making it possible to ban or deport enemy aliens and extending the naturalization time to five years. Forty million European immigrants would take advantage of this very open immigration policy in the centuries that followed.
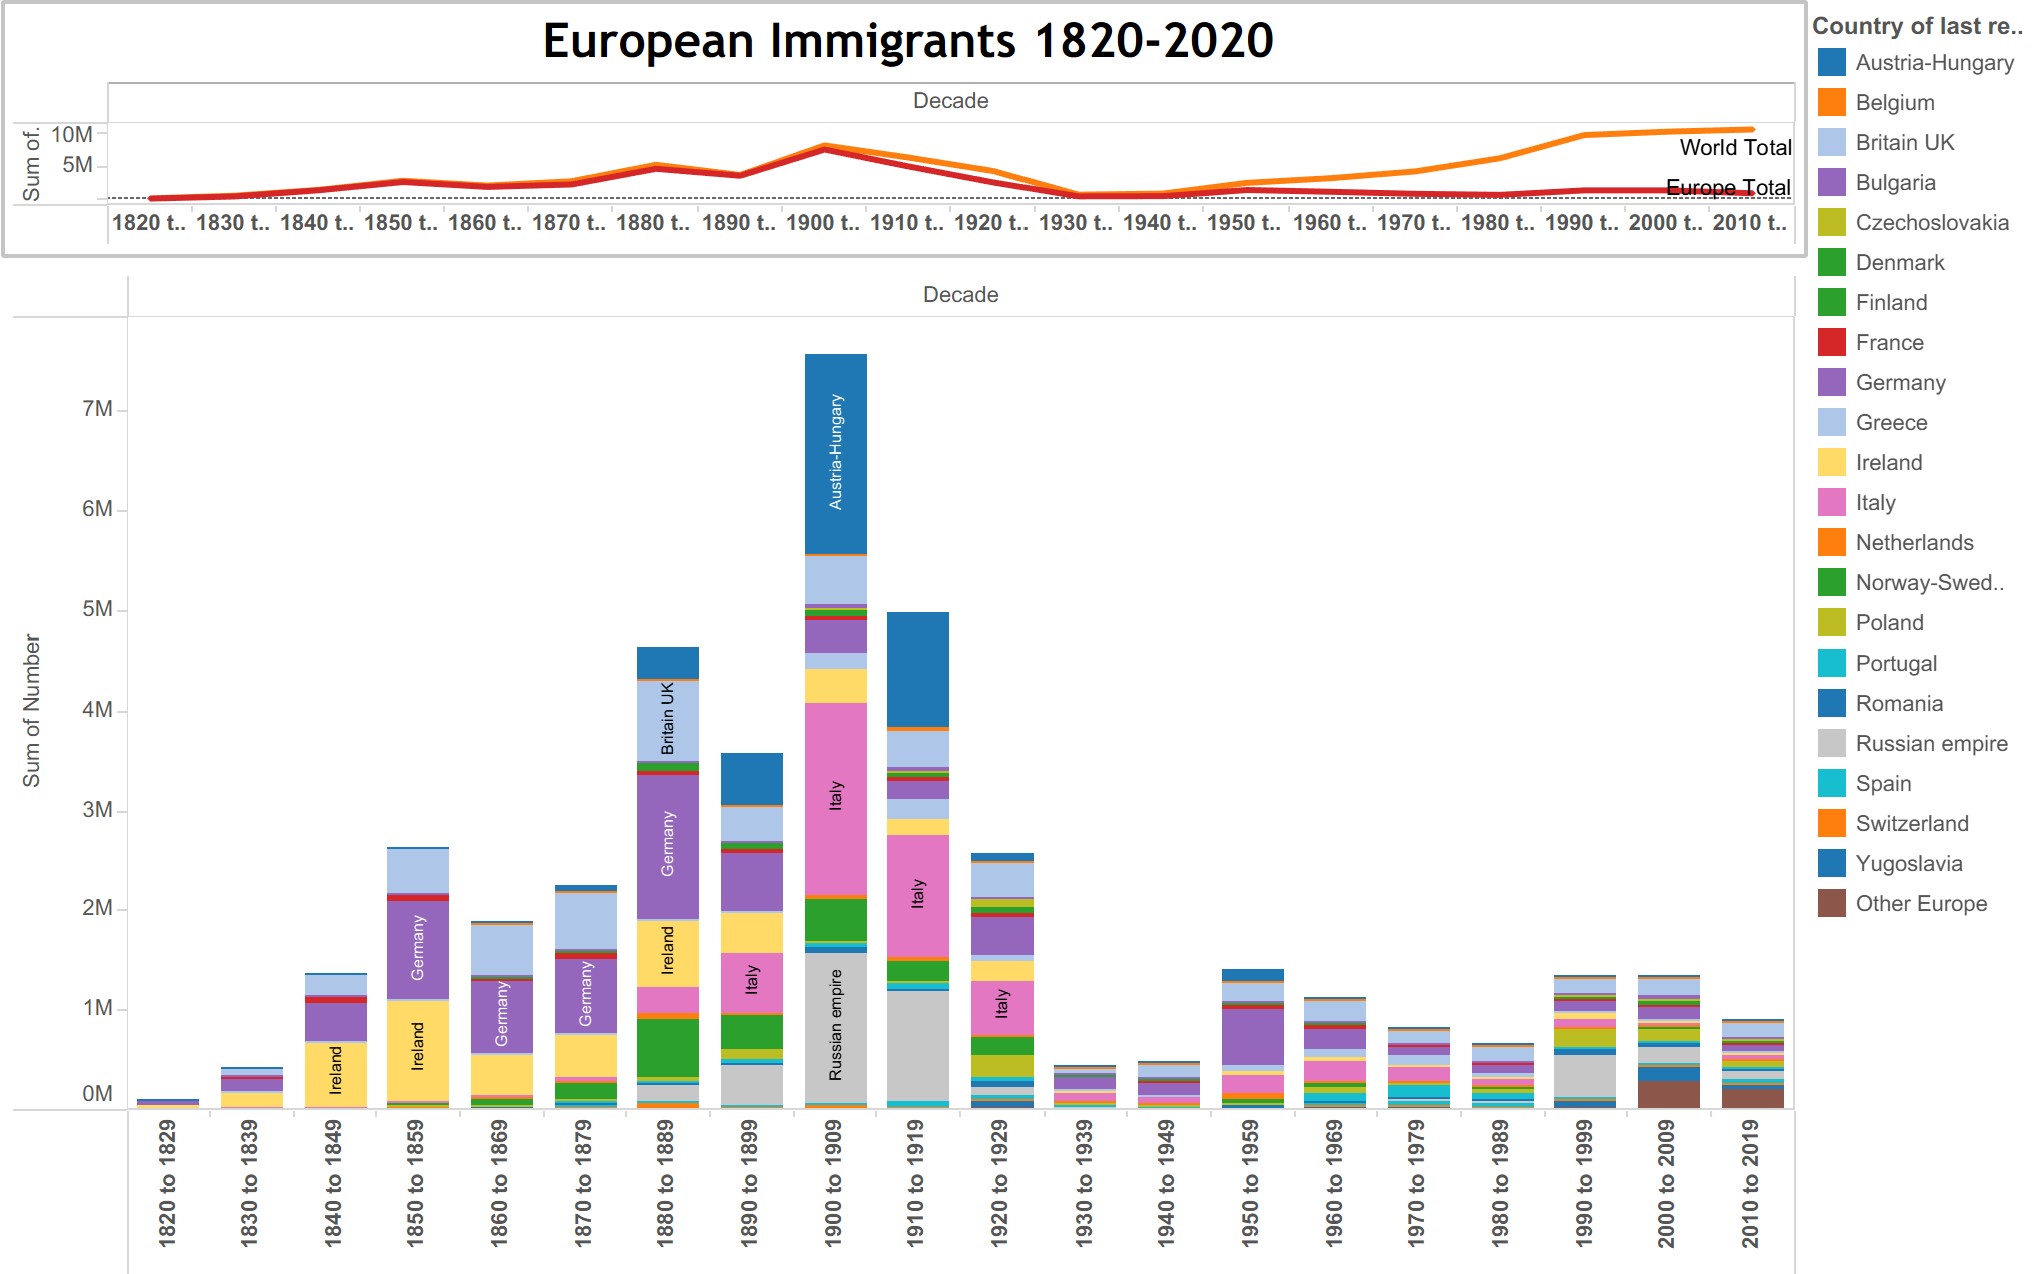
The graph above shows the rhythms and distribution of that story. Volumes rose mostly consistantly through the 19th century - with timeouts for US and European wars - peaking at above 7 million in the first decade of the 20th century. In 1924 Congress shut the door, enacting severe quotas that ended all immigration from Asia and imposing tight quotas on most of Europe, favoring only Great Britain, and to a lessor extent Germany and Ireland. In the deeply xenophobic and eugenics-inflected logic of the lawmakers, the quotas of the 1924 law were meant to protect the "Anglo-Saxon heritage" of the United States.
The plunging volume of immigration in the 1930s and 1940s reflected those restrictions and also the troubled conditions of depression and war. But notice what followed: Although restrained by quotas, volumes increased in the 1950s as Europe struggled to recover from the devastation of World War II, then declined in the 1960s and 1970s, as European economies provided more opportunites and geopolitics made immigration less attractive.
In 1965, Congress rewrote immigration law, raising limits and establishing uniform quotas for all nations (later modified with special allowances). People from Asia, Middle East, and Africa took advantage of the new rules, but western Europeans were little interested. Eastern Europeans have dominated the reduced European flow since the collapse of the Soviet bloc in 1989.
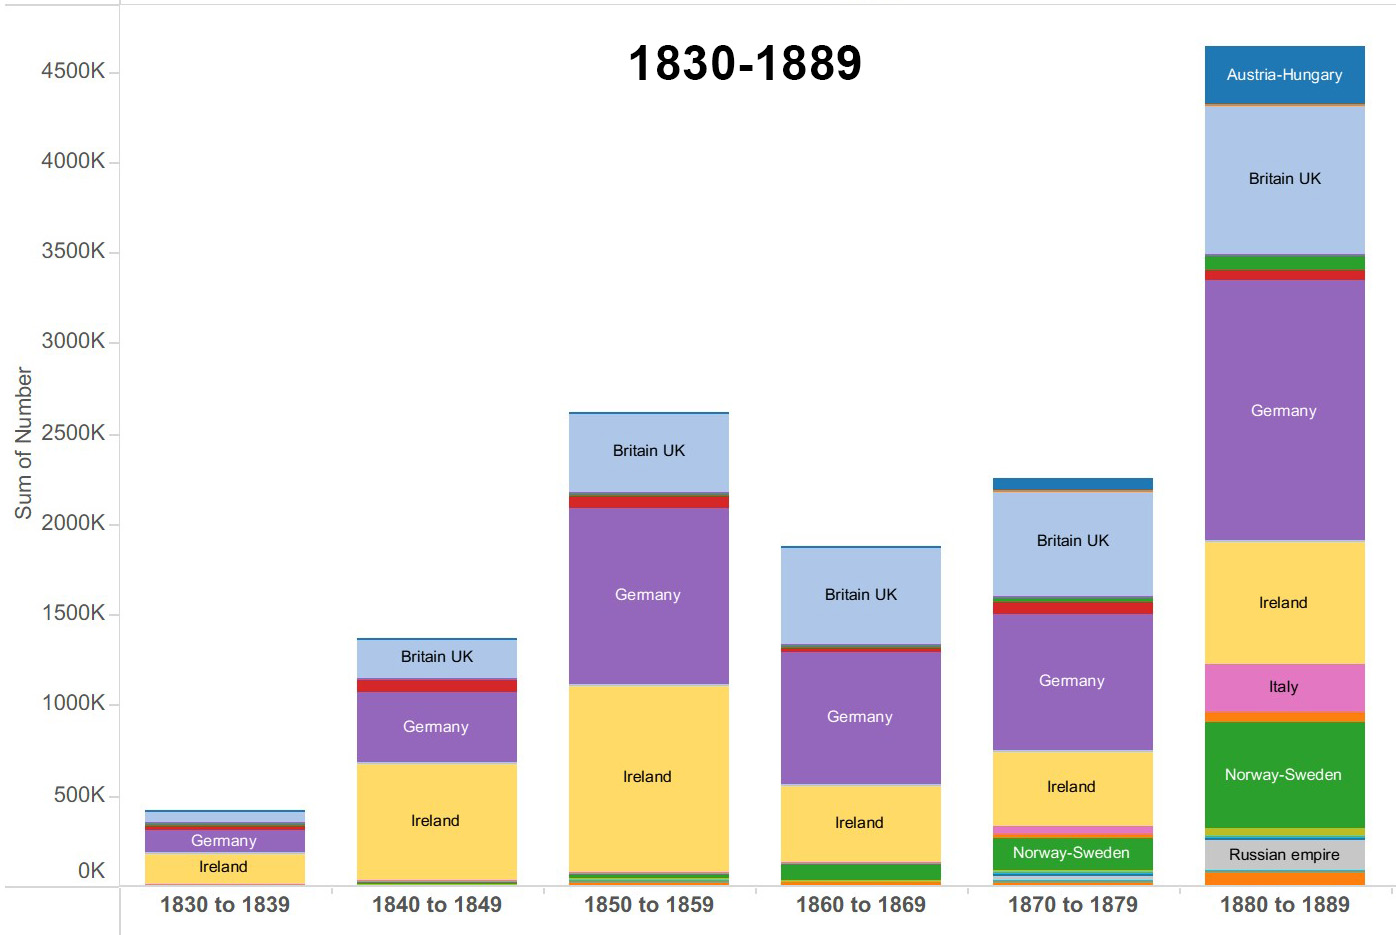
The story of European immigration is conventionally broken into four phases, reflecting significant changes in legal, geopolitical, and economic conditions as well as different origin patterns. The first phase (1830-1890) involved mostly northwest regions of Europe: Britain, Ireland, Germany, Sweden and Norway.
1830-1890
British immigration continued through the 19th century and indeed right up the present, constituting the most consistent pattern for any nation. Starting in the 1830s, Irish Catholic immigrants attracted attention, indeed hostility as the vanguard of Catholic Europeans who would complicate what had been a nation of Protestant Christians. This was before the potato famine triggered the Irish diaspora that would send millions upon millions to England, Canada, Australia, and the United States in the decades after 1845. Ireland would send more than 3 million of its sons and daughters to the US in the fifty years after the famine, second only to Germany in the 19th century.

Germany was not a unified nation until 1871, but immigrants from the Rhine region had settled in Pennsylvania in the 18th century. Starting in the 1830s, immigration from that and other German-speaking principalities accelerated, often in response to farming opportunities in lands west of the Appalacians that the federal government had seized from Indigenous nations. The map at right (a screenshot from one of our interactive maps) shows the distribution of nearly 2.6 million German-born immigrants living in the US in 1900. They had become a people of the Midwest, remaining today the dominant ancestry in some states.
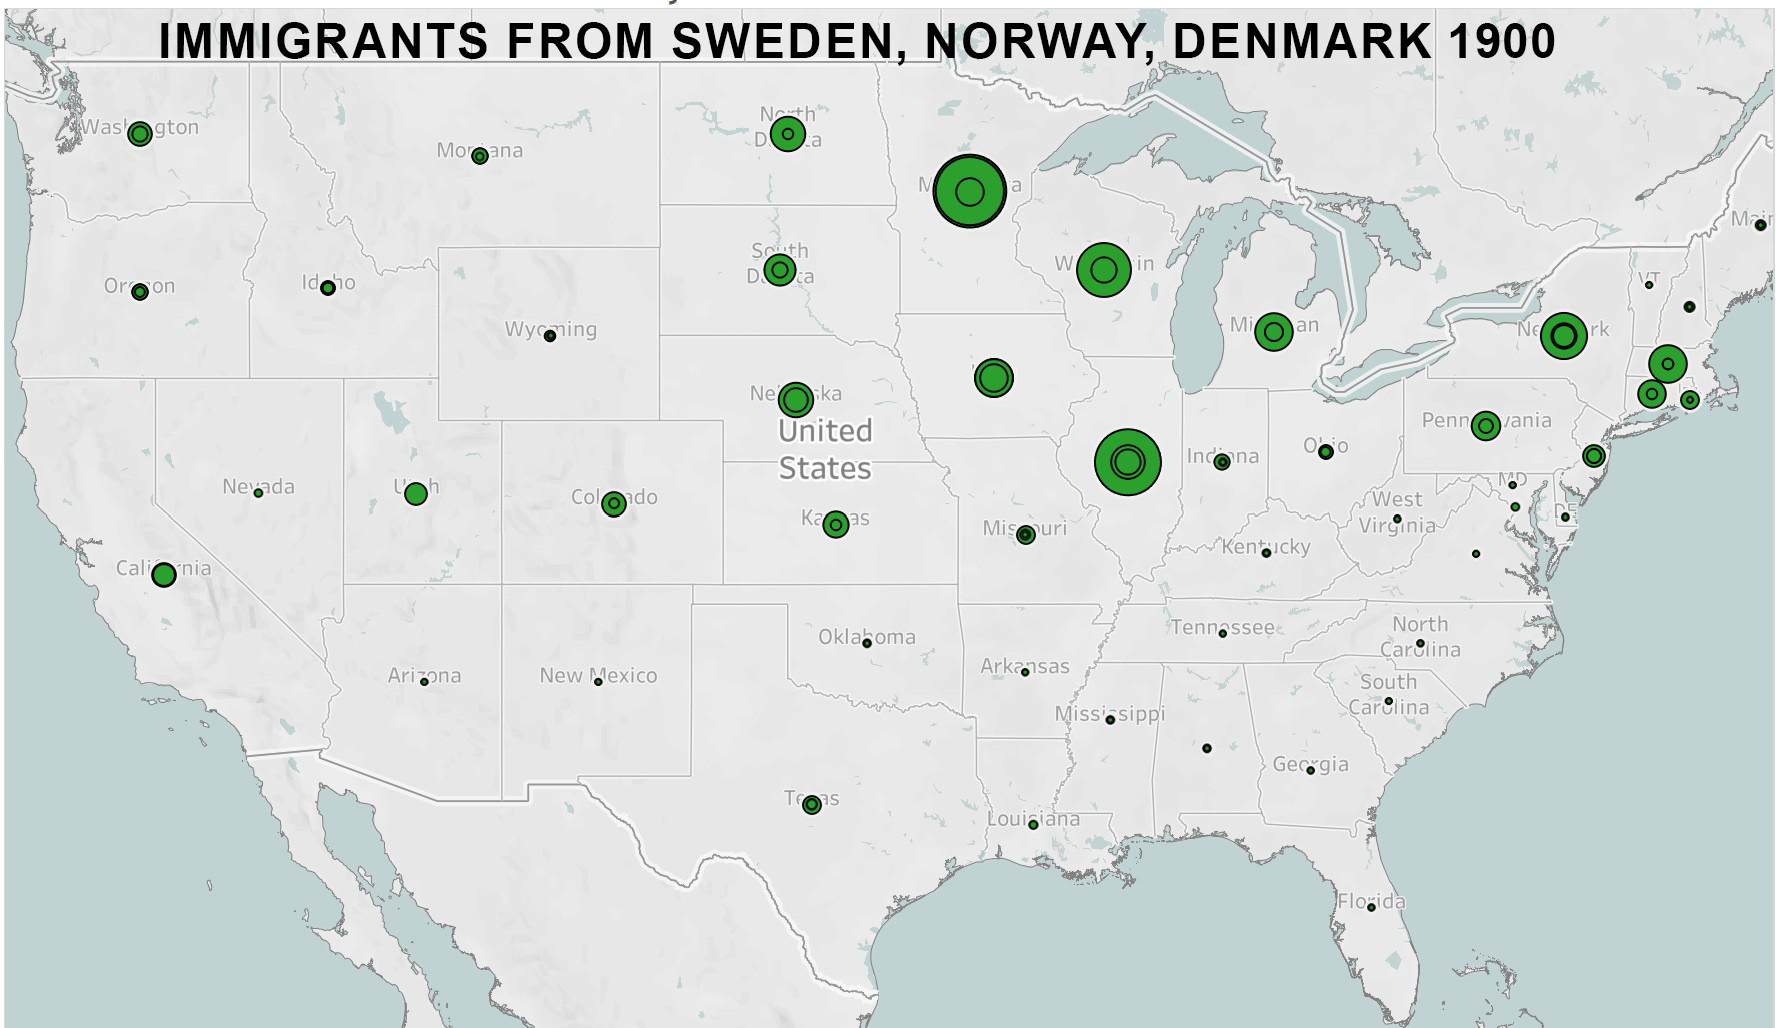
People from Norway, Sweden, and Denmark joined the northern European surge into the Midwest in the decades after the Civil War. This map shows the locations of more than 1.2 million Scandinavian immigrants in 1900. Sharing the Midwest with Germans but concentrating in Minnesota, Wisconsin, and Illinois, Scandinavians were drawn by farming opportunities and also forestry and fishing.
1890-1929
The changing volumes and origins of European immigration flows that became evident at the turn of the century were largely a product of economic transformations. Free or cheap land had been the big draw for immigrants in the 19th century, made possible by murderous Indian removals and Homestead laws that allowed white persons, both citizens and raw immigrants, to claim land for farming or prospecting. By the turn the century, the so-called frontier was closing, the cheap land was gone, and the United States had become an industrial power, indeed the world's premier industrial economy, with fast growing cities and exploding manufacturing and transportation sectors.
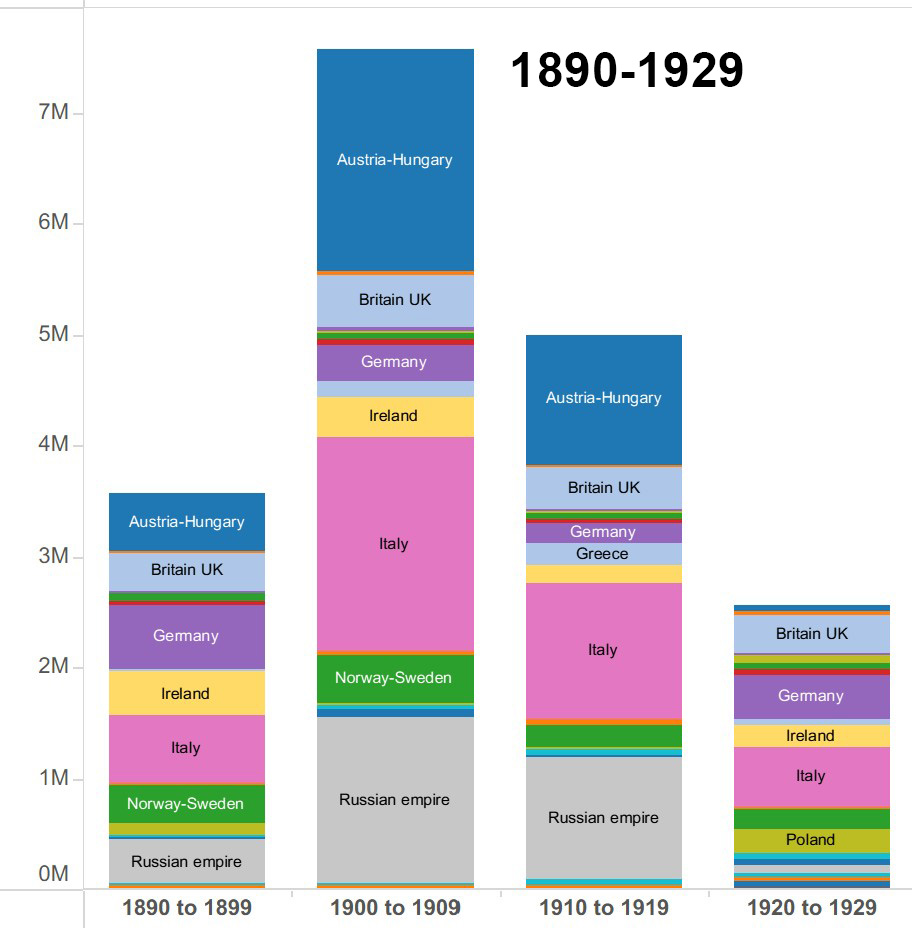
Some European immigrants had settled in cities in the middle decades of the 19th century, especially the Irish, who rarely had the resources to take up farming. Now in the new century, the overwhelming majority of immigrants would be looking for jobs in industry or urban occupations. Germans, Irish, and British continued to arrive in substantial numbers, but now as immigration volumes surged past 1 million in some years, the newcomers were mostly from southern and eastern Europe, from Italy and the vast Russian and Austro-Hungarian empires.
These areas were undergoing transformations of their own. Rural populations had grown beyond previous limits while railroads now crisscrossed the continent providing access to major ports where German and British shipping lines sold cheap tickets to the millions ready to cross the Atlantic.
This was the Ellis Island era of European immigration, symbolized by the ritual viewing of the Statue of Liberty in New York harbor. The federal government had begun to control immigration in 1882 with the Chinese Restriction Act that banned immigrants from China, following in 1891 with the creation of the Bureau of Immigration and the establishment of disembarcation centers including Ellis Island. Additional legislation required health examinations and then political examinations to weed out anarchists and persons with certain medical conditions. Otherwise the gates remained wide open to Europeans wishing to become Americans. More than 12 million took advantage before the gates closed in the late 1920s.
1924-1964
The demand for immigration restrictions was not new. Restrictionists had tried to block Irish and Catholic immigration under the banner of the American (Know-Nothing) Party in the 1850s. The campaign resumed in the 1890s led by the American Protective Association and Congress responded with bills that were vetoed by a string of presidents. In 1917, Congress overrode Woodrow Wilson's veto of a law requiring a literacy test and banning all Asians and a list of other "undesirables." Another law followed in 1921, establishing national quotas that were further reduced in the 1924 Johnson-Reed Immigration Restriction Act. Setting an initial annual total of 165,000 for all immigrants, it allocated 70% of the slots to Great Britain, Germany, and Ireland, leaving tiny quotas for southern and eastern European countries and none at all for Asians.
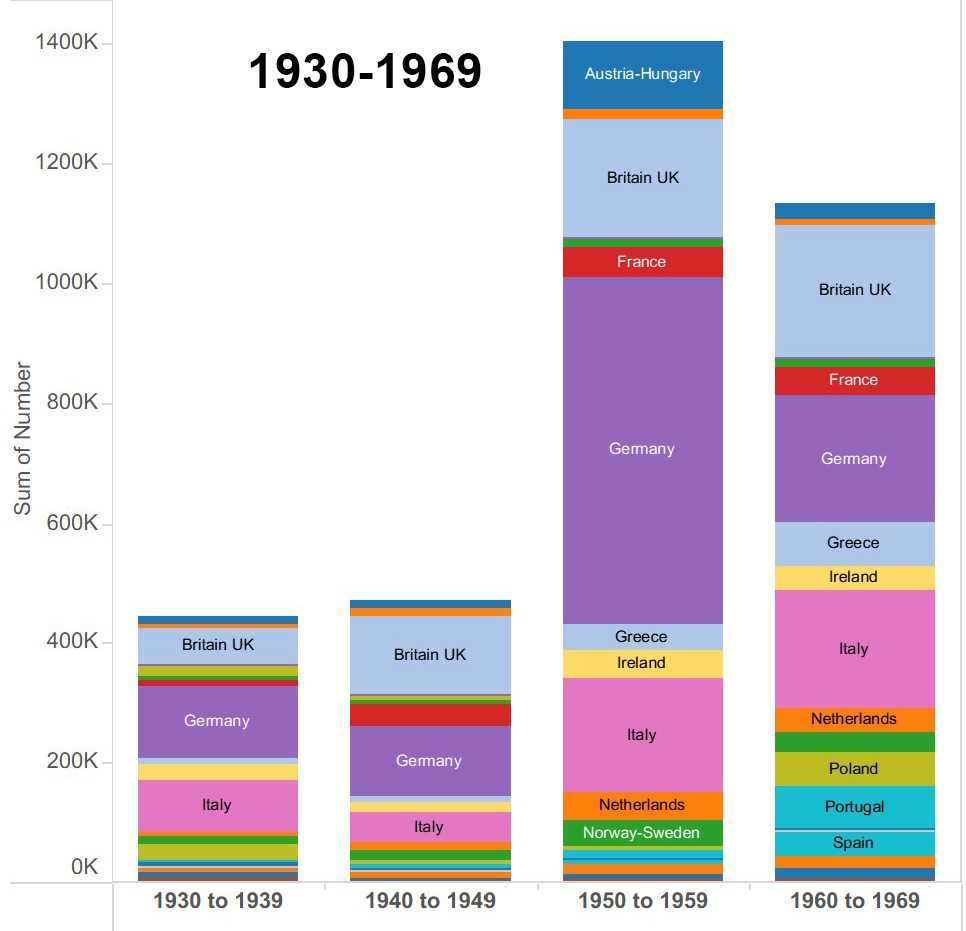
Notice in the accompanying graph that the totals in the 1930-1969 decades are dramatically lower than the previous period which saw more than 7 million Europeans arrive in one decade. And notice that it was mostly German and British immigrants arriving from Europe.
Not shown here is another dimension of the 1924 Immigration Act. Peoples of the Western hemisphere were excempt from the law, making it possible for immigration from Mexico, Canada, and the Carribean to accelerate in the forty year period before the law changed.
1965-2020
In 1965, soon after passing historic civil rights laws, Congress revised American immigration policy, declaring it was time to end the racist and Anglo-Saxonist rules that had so drastically limited who was allowed to come to the United States. The revised law raised the overall total for annual immigration and establish uniform quotas for all countries, initially 20,000 per year. Many in congress expected a renewal of the massive migration streams from Europe that had been suppressed since the 1920s. But Europe had changed. Economies had recovered and birth rates were falling. Why move to the US?
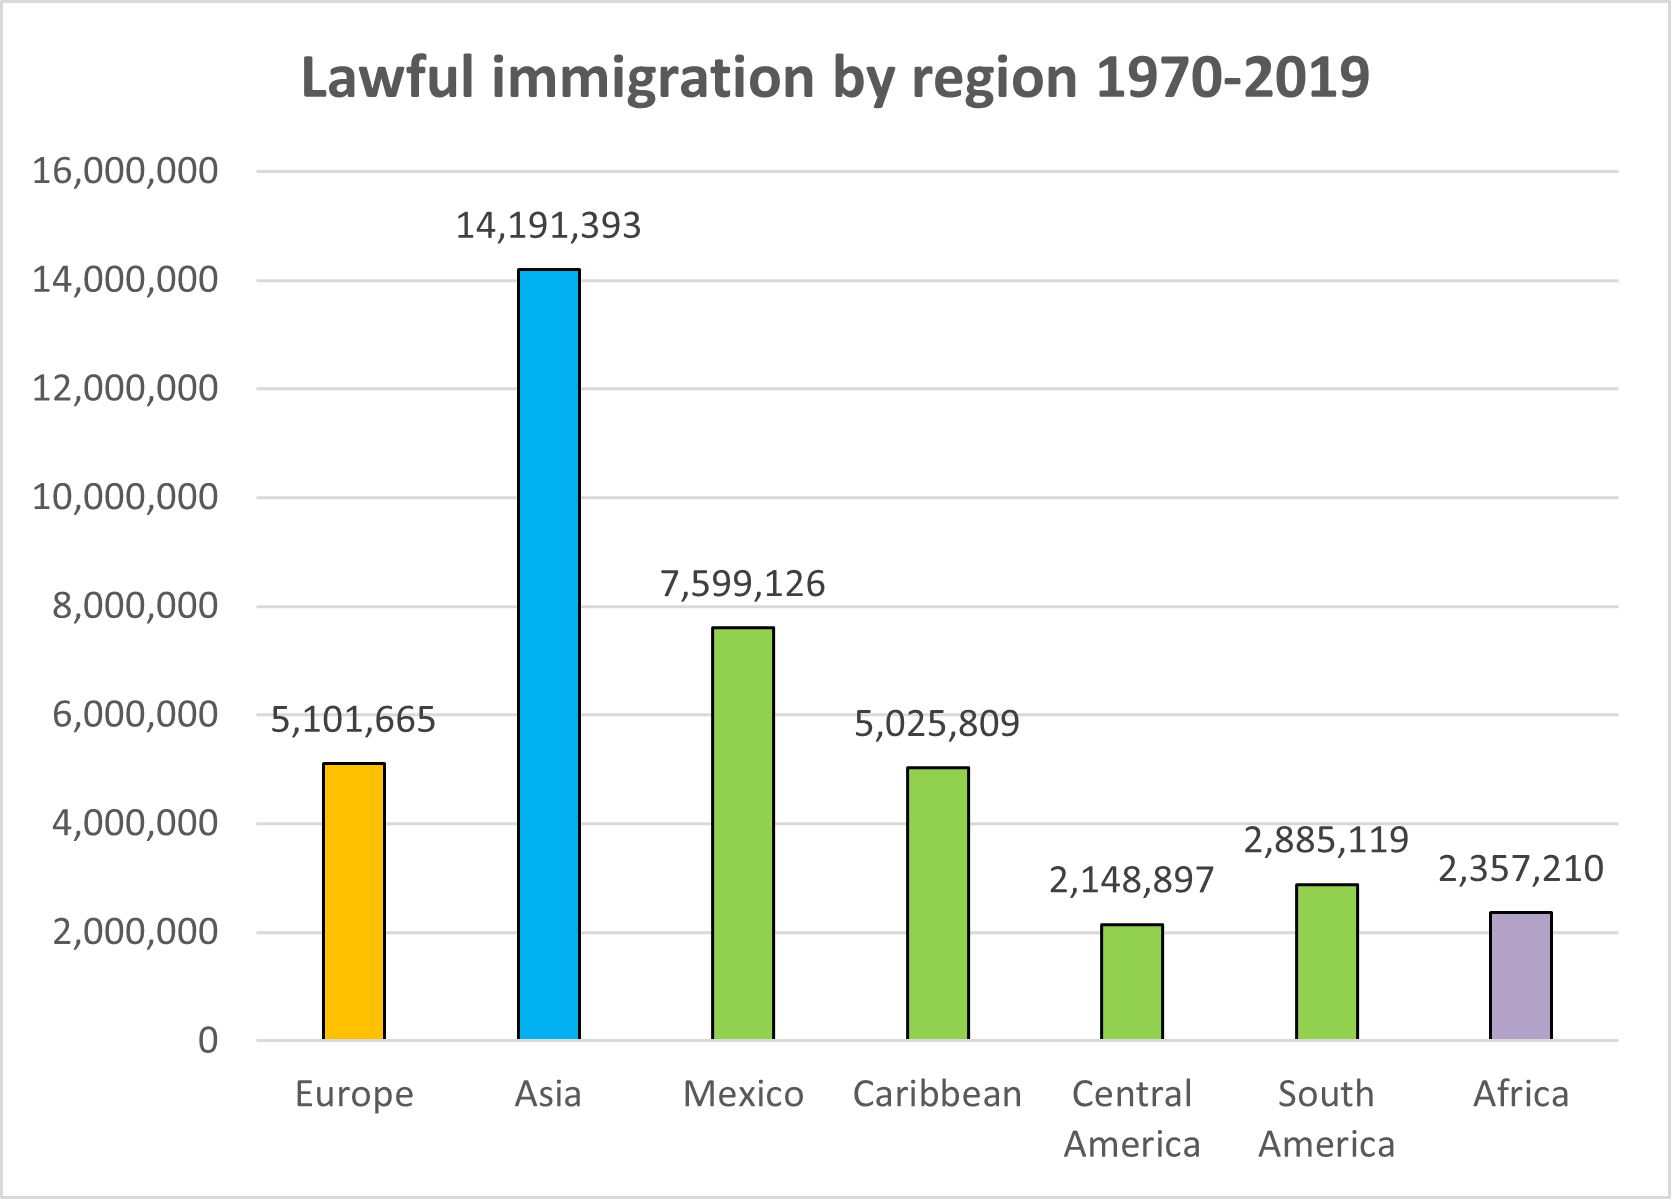
Quotas went unfilled for some European countries, while in other regions of the world, the chance to move was welcomed. Instead of Europeans the immigrants of the last 50 years have come mostly from Latin America and Asia, with Africa also contributing. The graph (upper right) shows the distributions of authorized immigrants. It does not include those who have entered or stayed in the US without permission.
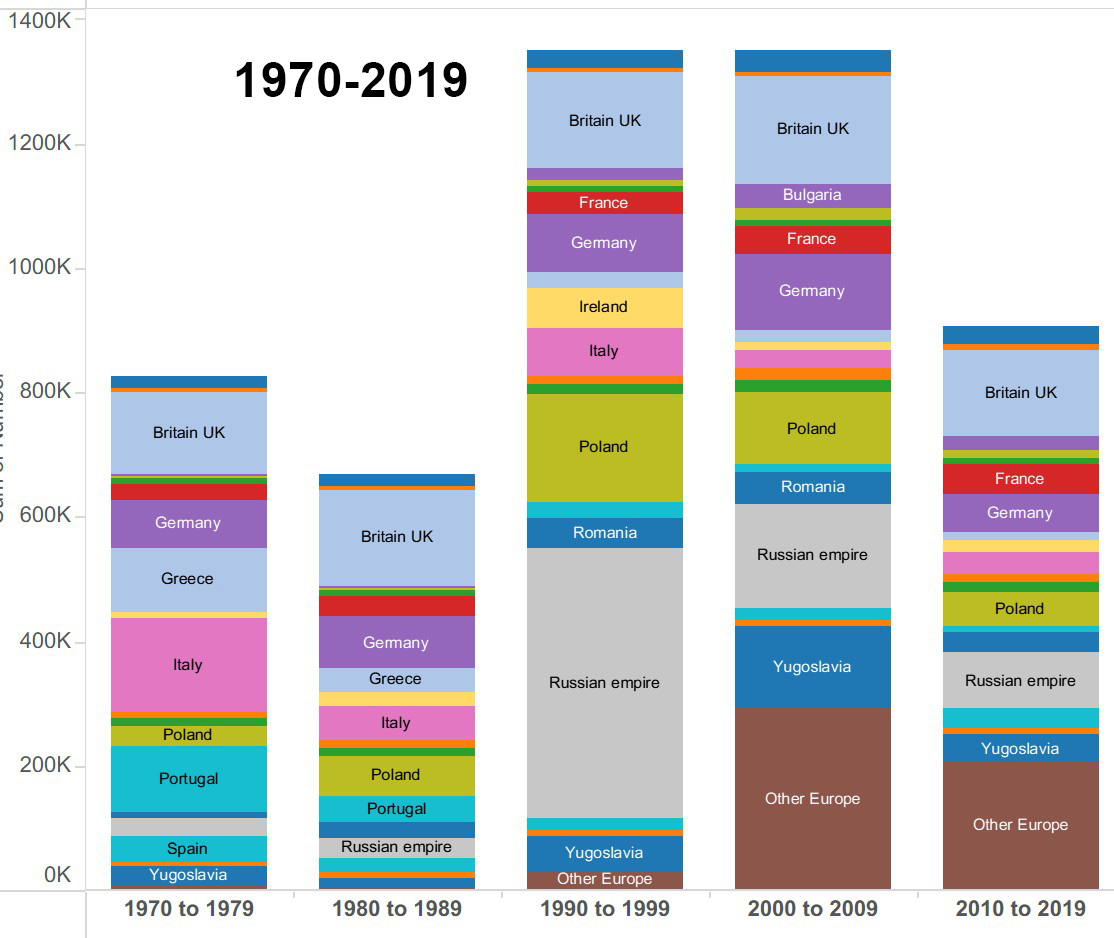
While the number of Europeans entering the US in the fifty years since 1970 is roughly the same as the number who entered during the restriction years, the origins are different. As seen in this graph, the Europeans most eager to come have been from the Soviet bloc, especially since the Soviet empire collapsed in 1989. In the chart at right recently independent nations like Ukraine and the Baltic republics are part of the "Russia/USSR" category while the "Other Europe" category also consists mostly of eastern European countries.
Ancestry 1980-2023
Since 1980, the Census Bureau has asked Americans about ancestry. The answers provide insights into the legacy of European immigration but also reflect complicated calculations of identity. Interpreting them is anything but straightforward. One challenge is that many people do not answer the question. Of the 203 million Americans who identified as white on the race question in 2023, 54 million (26%) failed to answer the ancestry question and another 14.5 million (8%) said that their ancestry was "American" or "white" or "Caucasian." We might guess that the latter responses suggest European backgrounds, but which ones? Curiously, the no response rate among whites was higher than other racial groupings, including self reported Black Americans who for well-known reasons have more difficulty than White Americans identifying countries of origin.

As the graph at right shows, the number of people claiming European ancestry has declined since 1980, despite increases in the number identifying as white. Now take a look at the national distribution of those answering the question. Not surprisingly, the largest totals belong to Germany and the UK (most actually saying their ancestors were English, Scottish, Welsh, or Scots-Irish, with only a fraction saying British). We should question Germany's lead in the most recent tally. It seems unlikely given the fertility headstart by British immigrant/colonists. It is likely that a disproportionate number of those claiming American/white/Caucasian ancestry are echoing the longstanding claim that British Americans are genuine Americans.
Also lower than expected is the number claiming Russian ancestry. At 1.3 million this ancestry number is only slightly larger than the number of US residents actually born in Russia, suggesting that few second or third generation descendents want to claim that ancestry. Conversely some ancestries remain popular across many generations. French, Dutch, Swedish ancestry claims outnumber the number of recent immigrants by multiples of 15 or more. Italians by a multiple of 33; Norwegians by a multiple of 92, and the 19 million Irish Americans who claimed that ancestry in 2023 outnumber recent immigrants by a factor of 135. These anomalies remind us that the ancestry question is a matter of identity and national pride, rather than a reliable guide to geneologies.
Mapping European Immigrant and Ancestry
Now dig deeper in the many interactive maps and charts that are the basis for this introduction. They show the dimensions of migrations from Europe decade by decade since 1820, allowing you to examine separately the volumes of migration of people of each nationality and explore recent distributions of persons claiming European ancestries. Explore