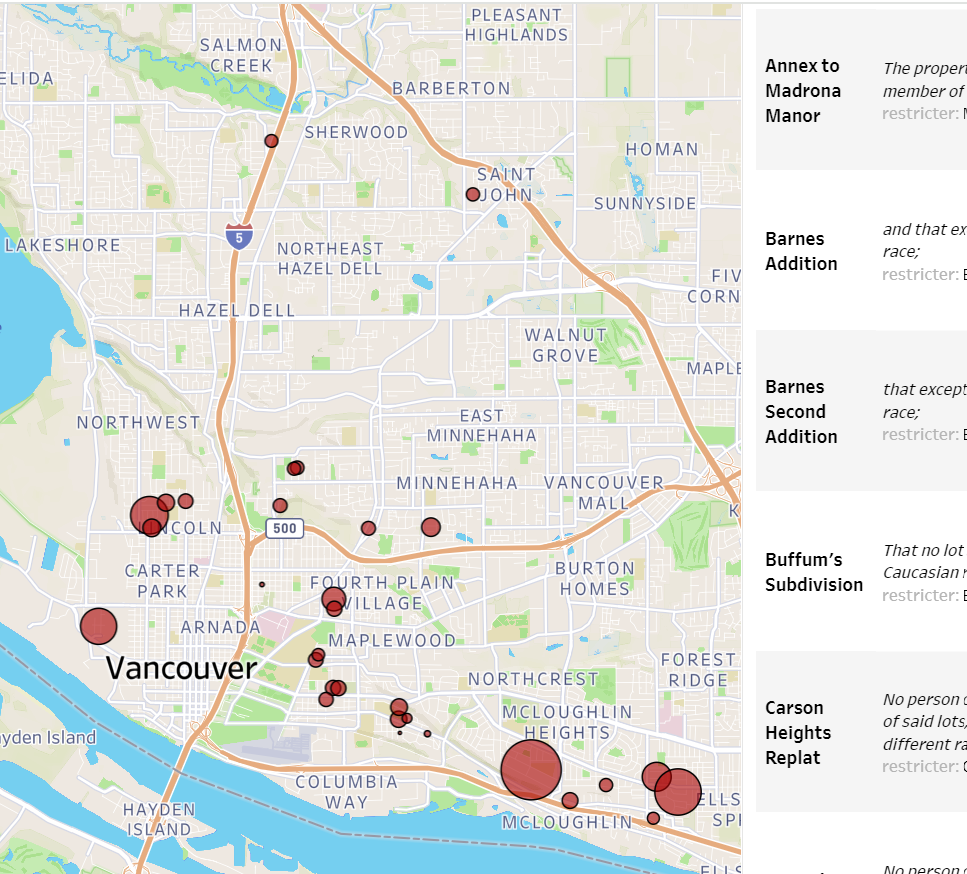
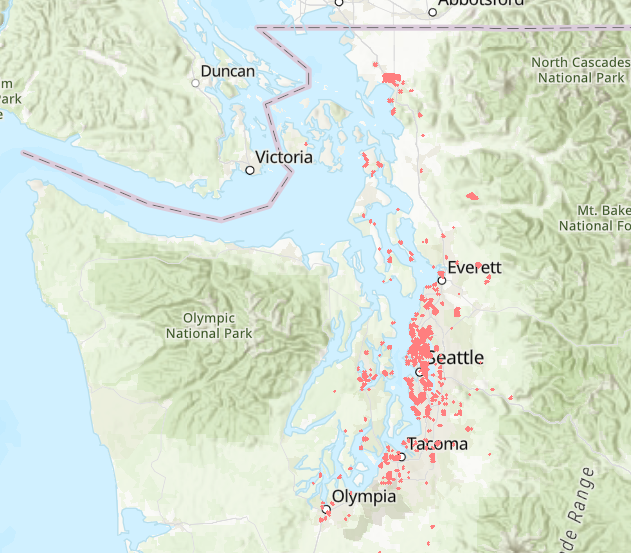
This interactive map shows the location of more than 1,367 properties that carried racial restrictions. Zoom and click to see addresses and restriction language. Restricted properties are colored RED. Click for details. Left panel allows you to search by address and activate layers and shows several charts.
See Reading the Map below for full explanation of terminology and the geography and history of restrictions.
(Map by Liz Peng)
Reading the map
This preliminary map shows where racial restrictions were added to property records in the decades before 1968. The map currently shows more than 1,367 properties in 34 subdivisions, but our research is ongoing, so check back for updates. Zoom for a closer look or use the search tool. Do not assume that areas without marks were unrestricted. WHITE-colored census tracts practiced racial exclusion by other means. NOTE: our research is ongoing. We are adding and correcting. Please report suspected mistakes.
The Logic of Restrictions
Areas platted (subdivided) between 1925 and 1950 were most likely to be restricted. Realtors and developers wrote racial exclusions into the initial subdivision documents. All properties in the subdivision were thus legally restricted. It was more complicated to restrict older areas. Neighborhood associations sometimes organized petition drives and convinced white homeowners to add racial restriction clauses to their properties. However, just because there are some areas on the map that appear to be unrestricted, does not mean that racial exclusion was not enforced by other means.
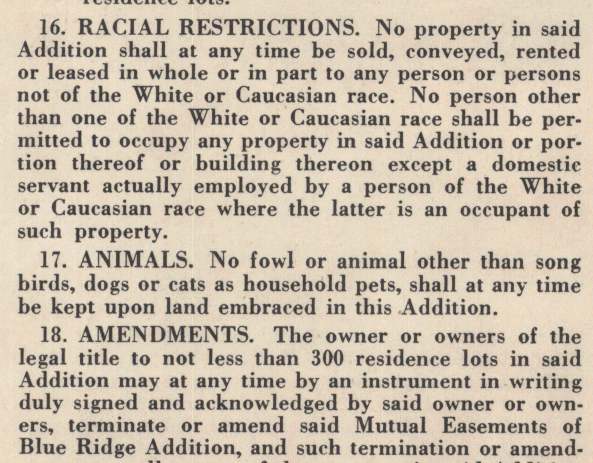
The Language of Restrictions
Look at the language of restriction in these deeds. Some specify that neighborhoods are reserved for "Whites," while others enumerate the prohibited racial groups. And the wording is curious. In the terminology of the 1920s-1940s "Hebrews" meant Jews; "Ethiopians" meant all African ancestries; "Malays" meant Filipinos; "Mongolians" meant all East Asian ancestries; "Hindus" meant all South Asians.
Deeds, Plats, Covenants, Petitions
When you click on a property, the pop-up displays address, subdivision (plat), the language of restriction, developer, initial date of restriction, and documentation. This can be either a deed, plat document covering all properties in the subdivision, CCR (separate document filed by developer covering the subdivision), or petition filed by a group of owners covering their listed properties. The last possibility is "Sanborn rule." Courts usually ruled that restrictions could apply even if not mentioned in a deed of sale provided the developer had routinely imposed them in earlier sales. This derived from a 1925 Michigan Supreme Court decision in Sanborn v. McLean.
Why do so many neighborhoods appear to be unrestricted?
Restrictive covenants were only one of the tools used to exclude people of color. In older neighborhoods and in the suburban areas that were beginning to develop in the 1950s deed restrictions were too complicated to be widely employed. White supremacists used other means. Real estate agents refused to show property in white neighborhoods and if a family did find a house to rent or buy, they faced neighborhood hostility, harassment, and sometimes violence. Many parts of the county were effectively Sundown Towns.
- Explore Maps of Sundown Towns
Credits
We are grateful to the research team from Central Washington University for searching through the volumes of Clark County deeds, Ulysis Cruz–Antonio. Map by Liz Peng